
Process monitoring HRIexpert®#
What is HRIexpert®#
HRIexpert® extends the functional scope of HRI® to include frequency analysis (FFT) of high-frequency data. This function enables the targeted monitoring of specific orders to effectively prevent quality failures of the produced components and to detect them at an early stage, before the next process. The ability to define limit values individually and in detail is extended to orders or even entire limit curves. Saving the frequency curves creates the basis for a workpiece-related detailed analysis.
What added value does HRIexpert® offer#
Order analysis and monitoring are essential functions that require expert knowledge for parameterization. Advanced logging functions enable detailed recording of various machining processes. The HRIexpert® system generates CSV files that are compatible with third-party systems, ensuring seamless integration into various platforms.
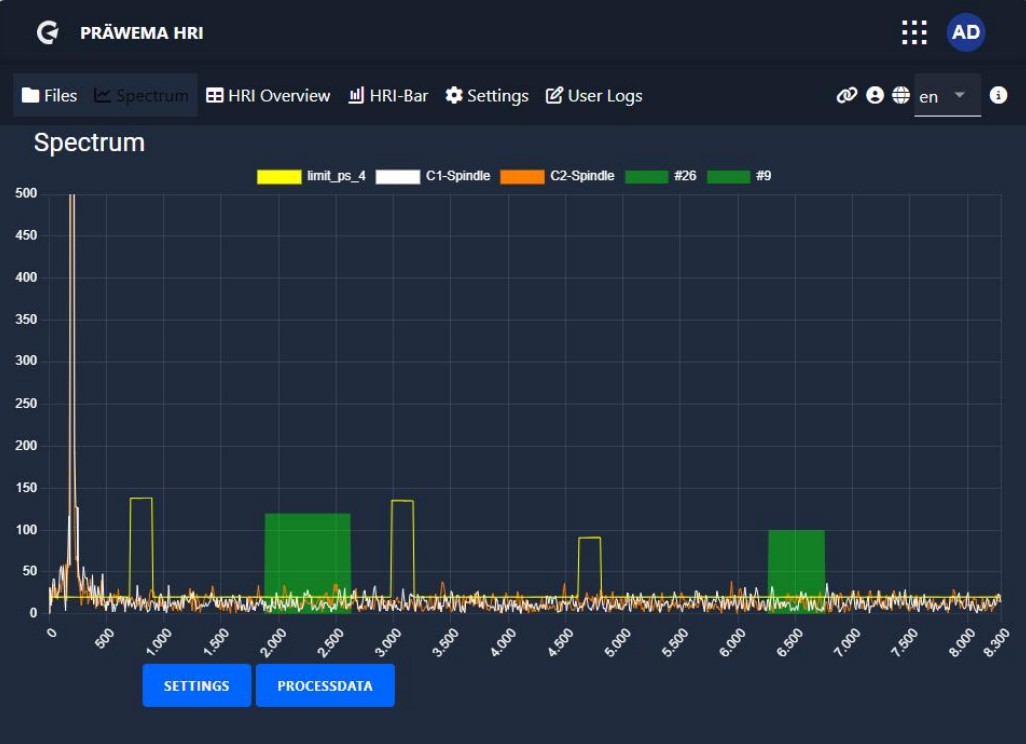
Example of an order analysis#
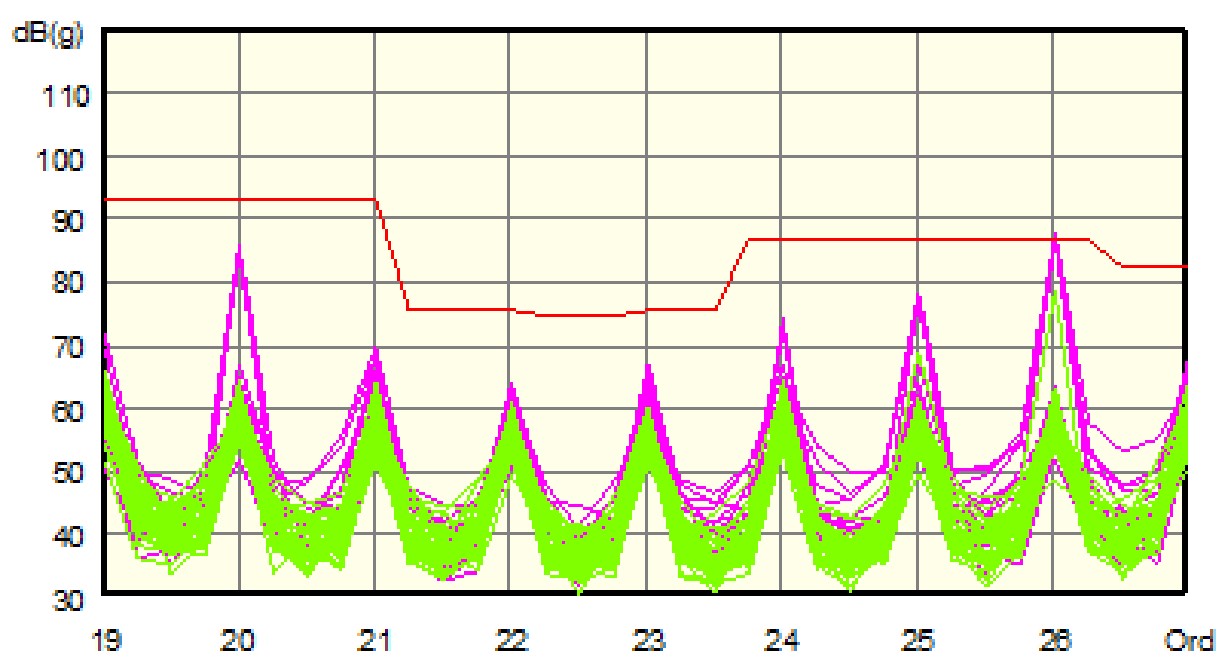
In the example, the 26th order causes problems in the transmission. This order can be specifically monitored with HRIexpert® and the conspicuous workpieces are ejected. The red line has been defined by the test bench.
HRIexpert® settings#
Example of an order analysis#
- As in the example, the 26th order is monitored with a bandwidth of two orders.
- All workpieces that exceed the limit of 100 mg are rejected as SPC parts.
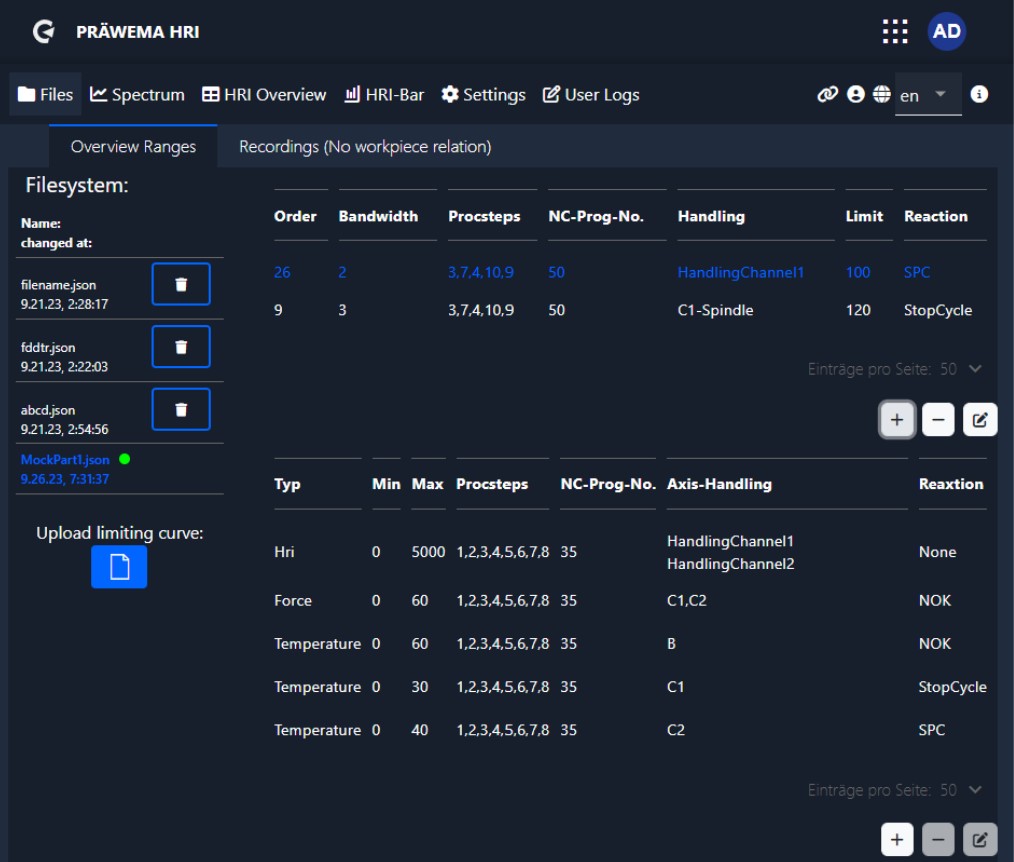
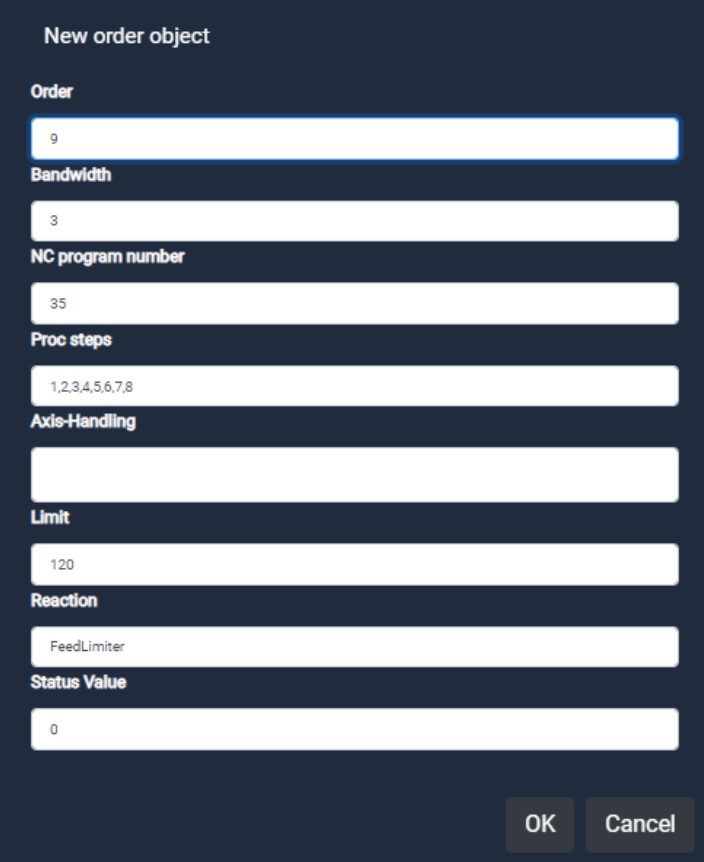
| Designation | Description |
|---|---|
| Orders | Orders to be monitored => Feedback from the assembly line required |
| Bandwidth | Bandwidth of orders |
| Proc steps | Process steps of processing that are monitored |
| NC prog no | NC program number to be monitored |
| Handling | Selection of which spindle or which sensor is to be monitored |
| Limit | Limit value which, when exceeded, triggers the error reaction |
| Reaction | Error reaction that is triggered when the value is exceeded |
| Status value | In preparation |
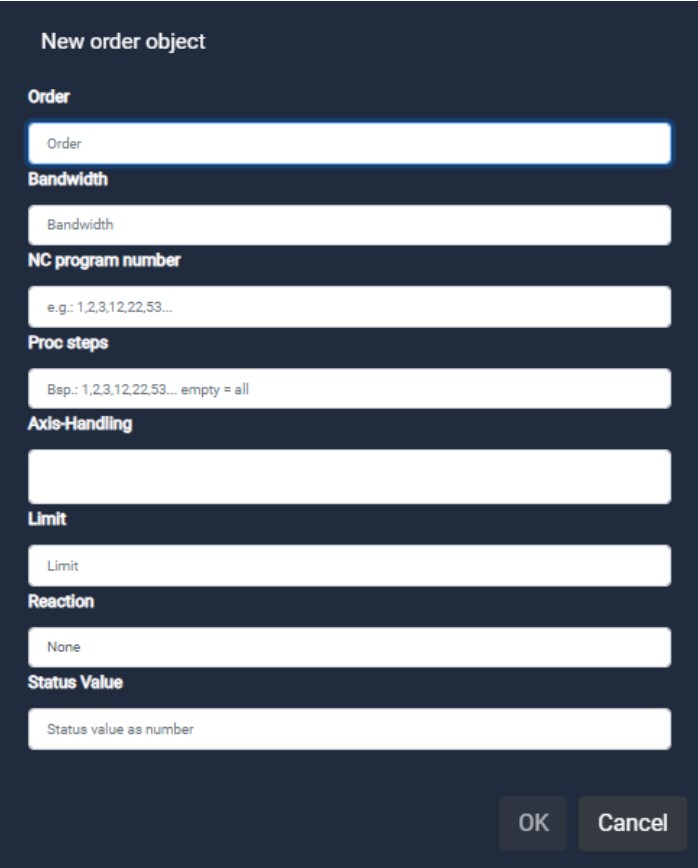
Since version 2.5 an edit screen has been added. The limits are easier to set with the screen and the possibility of incorrect entries has been minimized.
The frequency objects are displayed in the spectrum screen as a bar graph. If the process step is not active, the bar is colored light blue. If the limit value is exceeded, the bar changes its color to red, otherwise the bar is colored green.
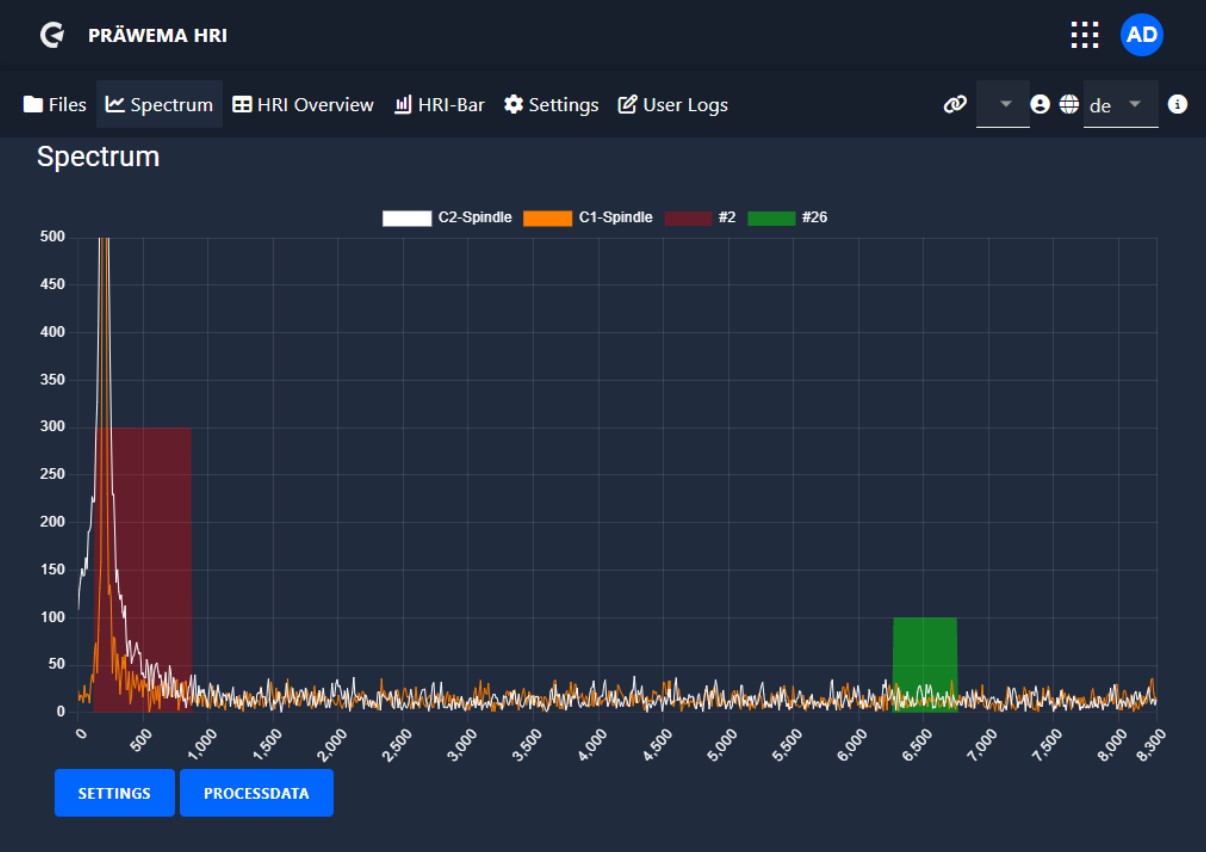
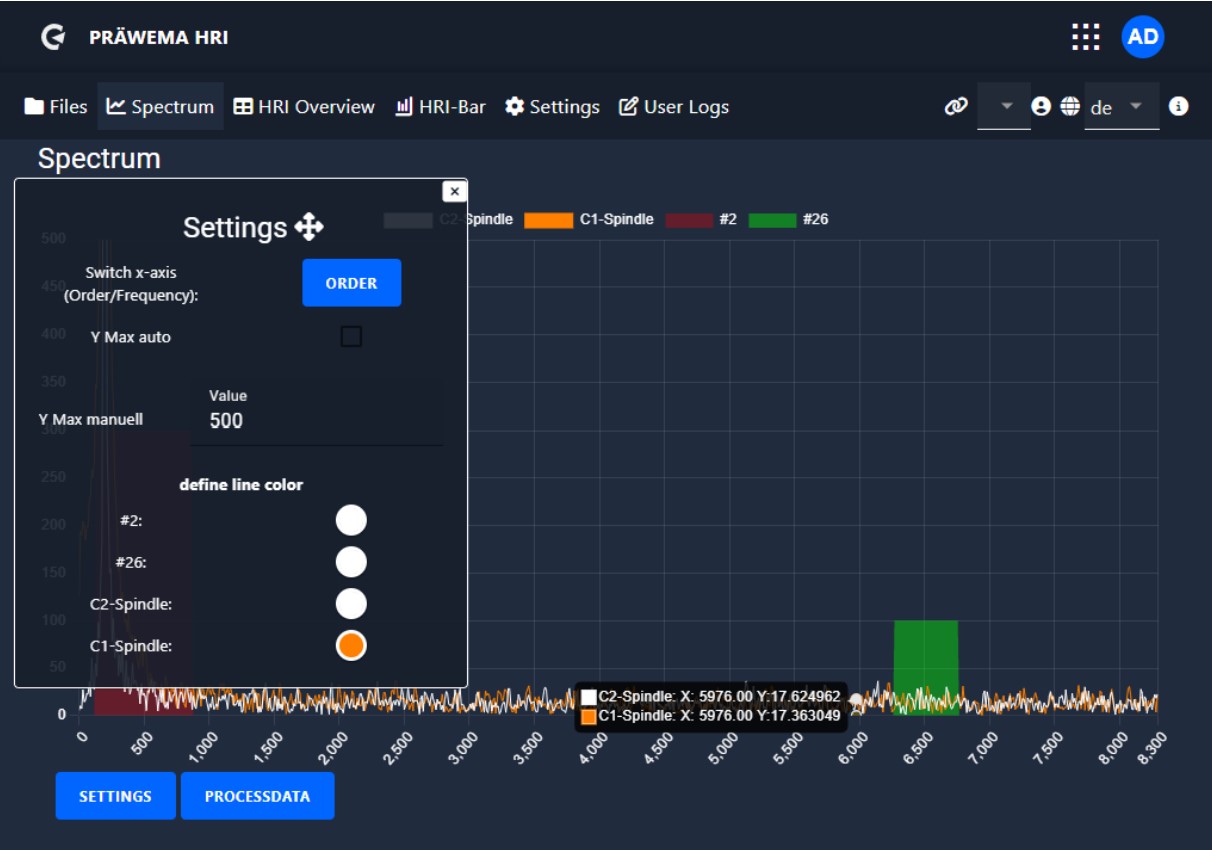
In the “settings" tab, the X-axis can be switched between the frequency and the orders in relation to the speed of the workpiece spindle. The Y-axis offers the option of either being set to a fixed value or being adjusted automatically. The colors of the individual lines can also be set individually. All settings made are saved and are available again the next time the page is called up.
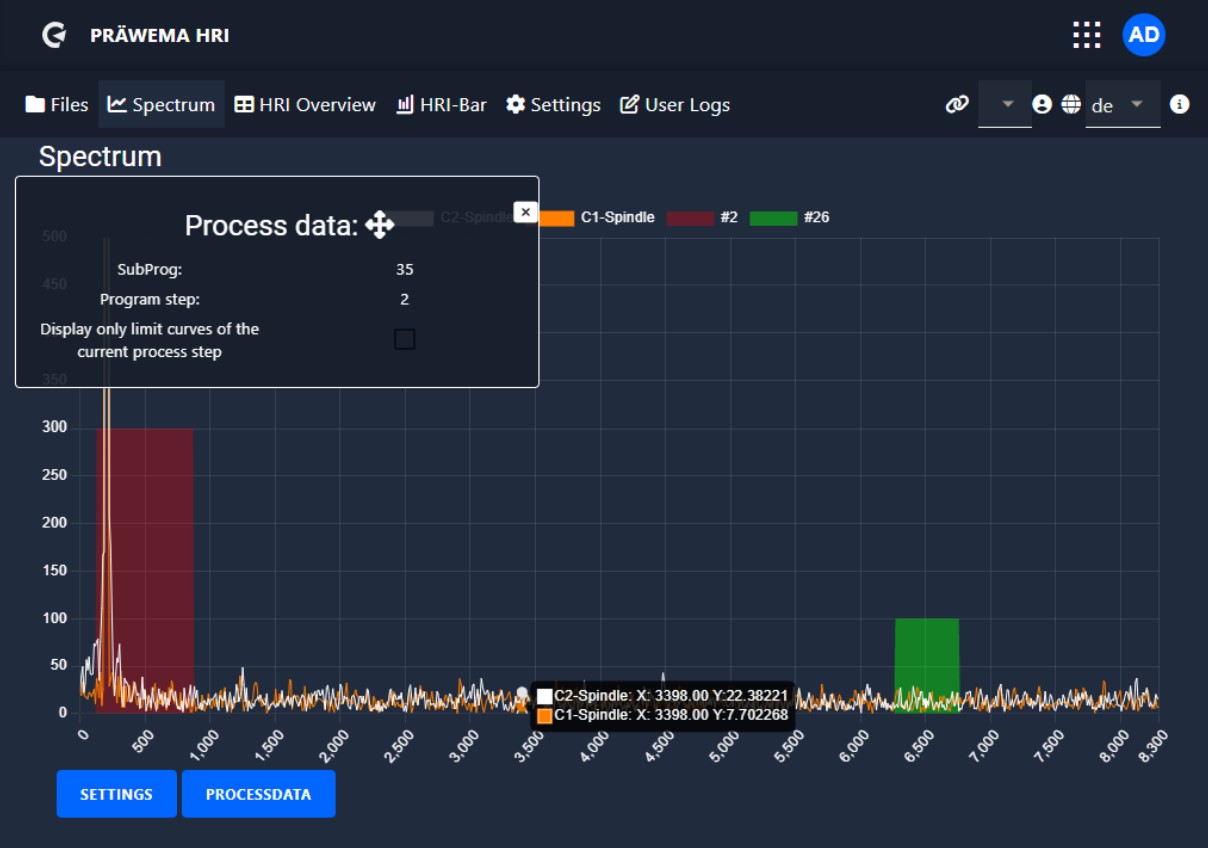
The current NC program and the current process step are displayed under Process data. This is used to check in which process step the machine is processing the workpieces. A button can be used to display the limit curves only in the current process step.
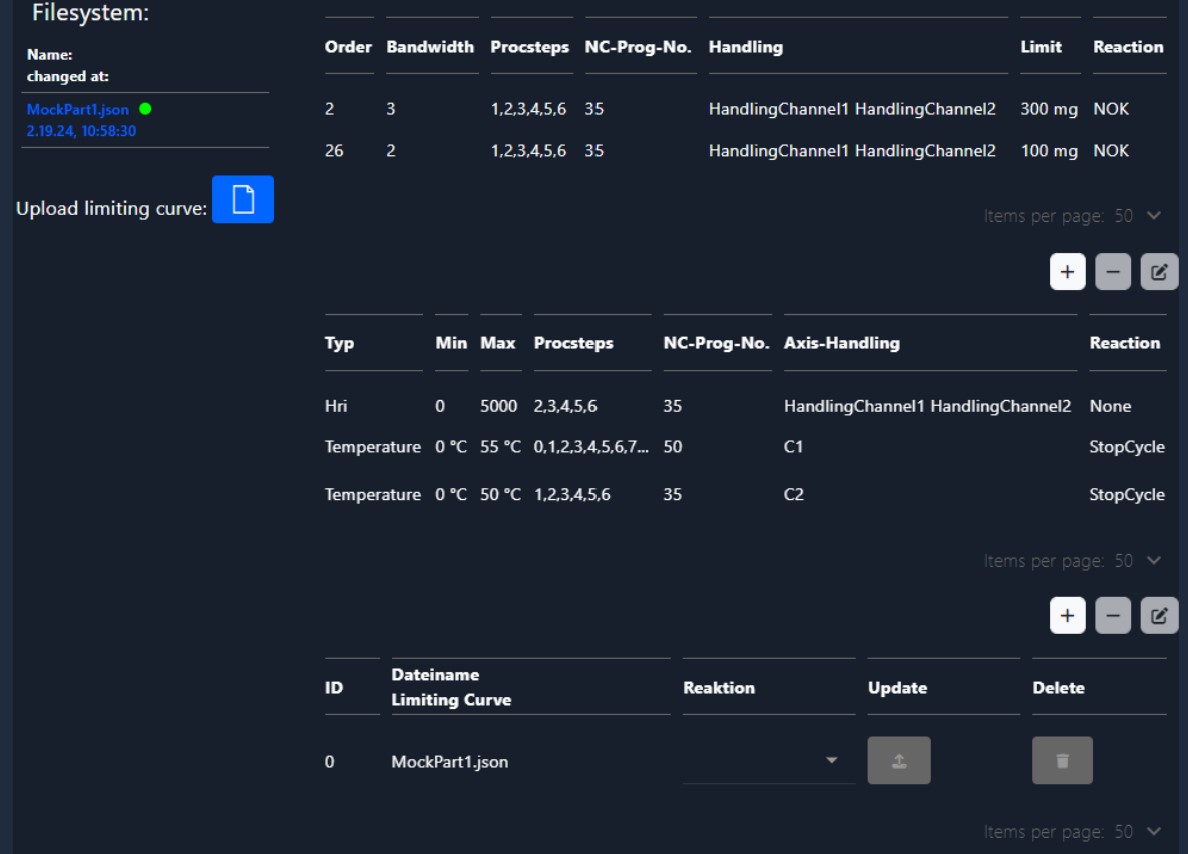
Limiting curve#
With HRI®analyze+ a limit curve can be created and saved as a JSON file. This limit curve can be read in and visualized with HRImachine. The name of the JSON file from the limiting curve must be the same name from the part.
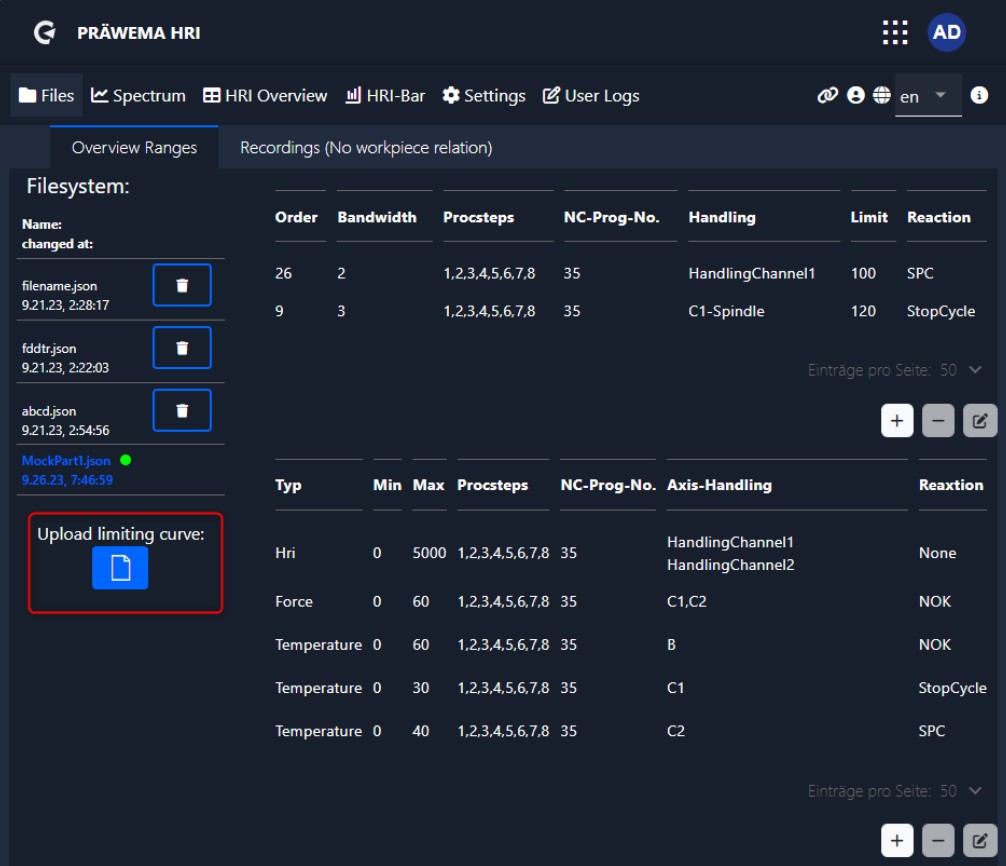
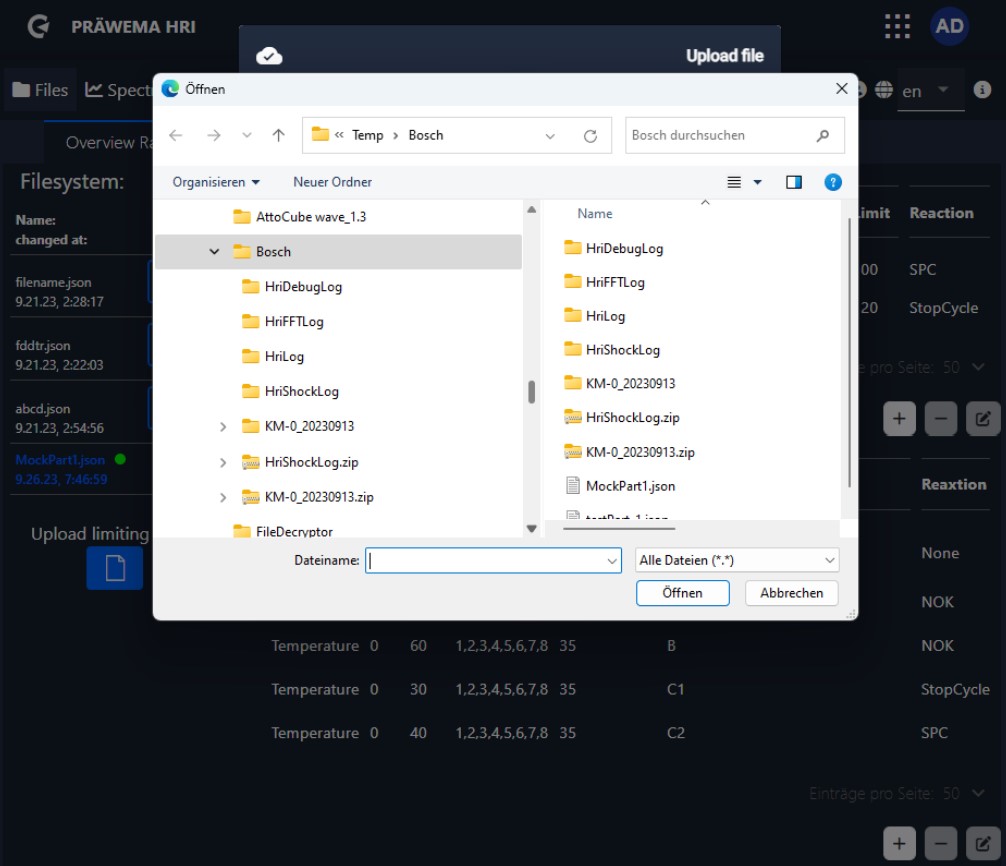
Clicking the button opens a second window. Here you can select the corresponding file to be loaded.
A file has been saved in the Downloads folder. The file name of the limiting curve must have the same name as the corresponding component. Otherwise, the limiting curve cannot be assigned to a component.
After loading the file, the loading bar changes color. There is no confirmation that the file has been loaded. After the file has been loaded successfully, you can switch to the spectrum page.
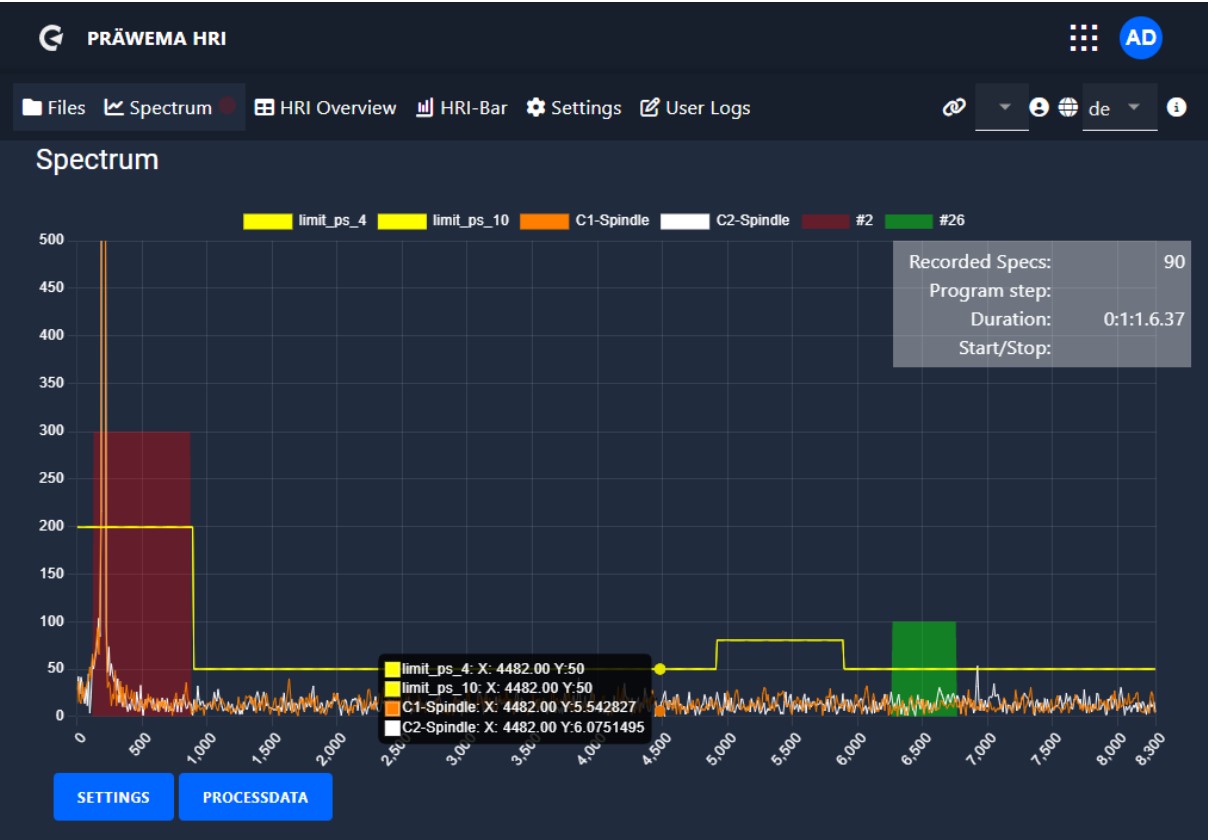
The loaded limiting curve is displayed in the visualization. The error response can be changed. An update of the limiting curve can be uploaded.
The limiting curve is displayed in the spectrum as a yellow border line. Each active process step has its own limiting curve.
Recordings spectrum page#
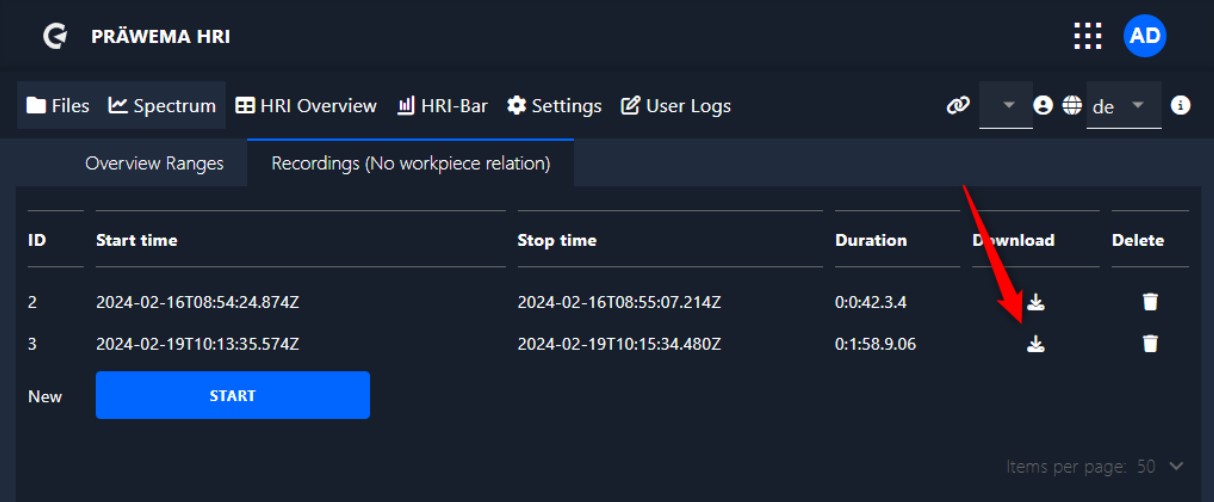
A manual recording function of the vibration spectra can be started on the Files page. The recording can also be stopped and saved here. The recording is saved as a BIN file. The recording can be opened and analyzed with HRIanalyze+.
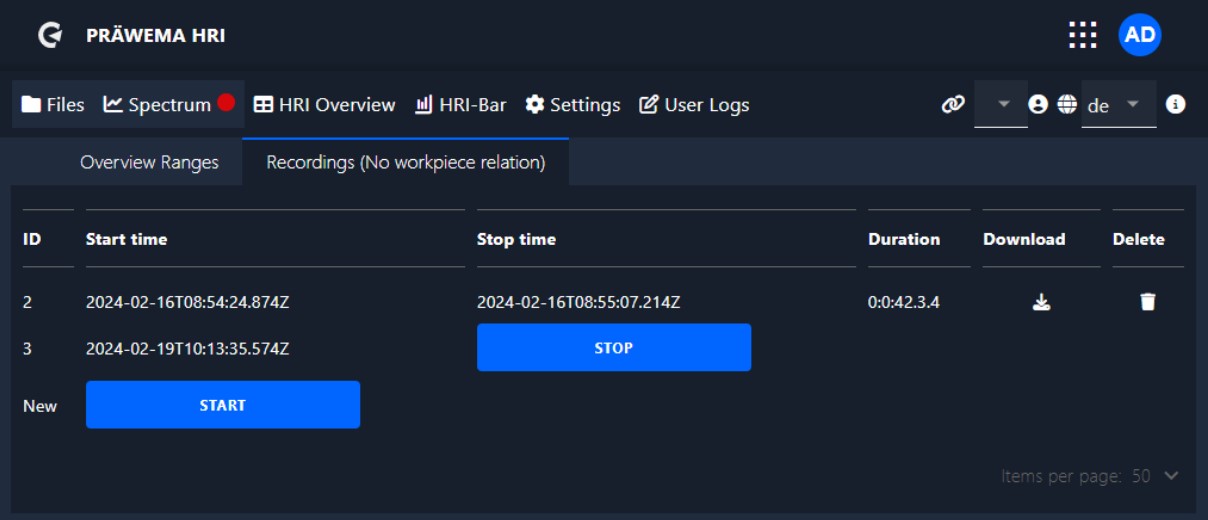
When the recording function is activated, an additional field is displayed on the Spectrum page. The recording can be started and stopped there. To save the recording, switch to the “Files” page.
After finishing the recording, the BIN file can be downloaded and saved. The analysis is then carried out with HRI®analyze+.
HRIexpert® Feed Limiter#
Feed Limiter with HRIexpert®#
To make the process more stable and to absorb acceleration peaks, a feed rate limit has been programmed. A limit value for vibration monitoring is programmed under HRIexpert®.
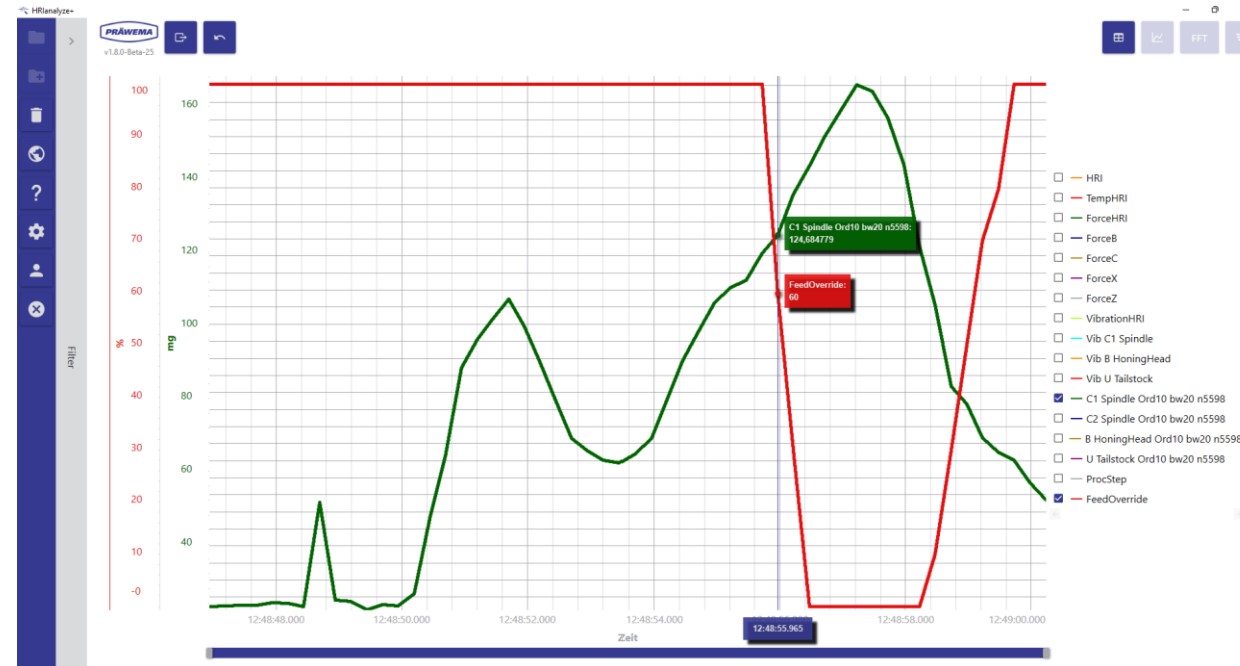
The feed rate limiter has been added to the selection of the error reaction. If 100% of the set limit is exceeded, the feed is reduced in 10% steps until the vibrations stabilize. If the vibrations fall below the 100% limit, the feed rate is increased again in steps. When 120 % of the limit is exceeded, the feed rate is reduced to 0 %. When the vibrations have fallen below 100 % of the limit, the feed rate is increased again to 100 % in 10 % steps.
The signals “Vibration C1 spindle” [for the first 20 orders, value in mg] and FeedOverride [feed limitation] are shown. When the limit of 120 mg is exceeded, the feed limitation becomes active and reduces the feed of the X axis.
Conclusion#
Thank you for taking the time to read through the second part of my comprehensive manual on HRI Expert. I hope that you have gained a deeper understanding of the system and its capabilities.
Upcoming in the HRI®analyze+ section, we will delve deeper into explore the creation and utilization of limit curves with HRI®analyze+, showcasing how these tools contribute to optimized process control and maintenance of stable machining operations.